Your browser does not support inline frames or is currently configured not to display inline frames.
Oil Prices 1946-Present
The first table shows the Annual Average Crude Oil Price from 1946 to the present. Prices are adjusted for Inflation to December 2011 prices using the Consumer Price Index (CPI-U) as presented by the Bureau of Labor Statistics.
 Note: Since these are ANNUAL Average prices they will not show the absolute peak price and will differ slightly from the Monthly Averages in our Oil Price Data in Chart Form.
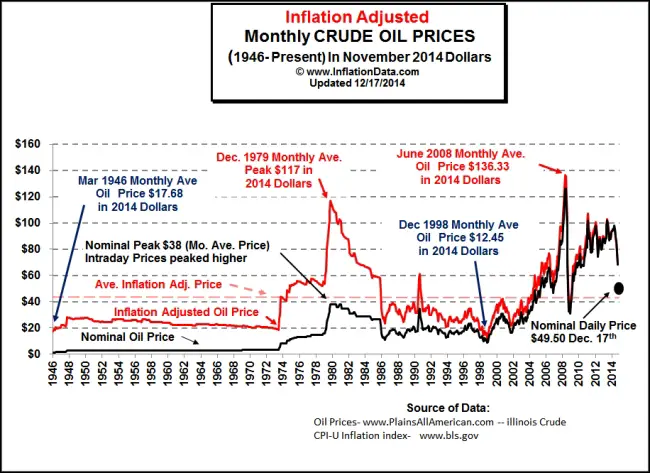
Also note that although the monthly Oil prices peaked in December 1979 the annual peak didn't occur until 1980 since the average of all the monthly prices was higher in 1980.
Inflation adjusted oil prices reached an all-time low in 1998 (lower than the price in 1946)! And then just ten years later Oil prices were at the all time high for crude oil (above the 1979-1980 prices) in real inflation adjusted terms (although not quite on an annual basis).
Prices are based on historical free market (stripper) oil prices of Illinois Crude as presented by IOGA . Price controlled prices were lower during the 1970's but resulted in artificially created gas lines and shortages and do not reflect the true free market price. Stripper prices were the actual free market prices of the time allowed for individual wells under special circumstances.
See also our price comparison of Oil vs. Gold. At $1000 is Gold Expensive? Oil Prices- Where Now?
Annual Average
Domestic Crude Oil Prices
(in $/Barrel) |
| 1946-Present |
| Year |
Nominal Price |
Inflation Adjusted Price |
| 1946 |
$1.63 |
$19.13 |
| 1947 |
$2.16 |
$22.49 |
| 1948 |
$2.77 |
$26.83 |
| 1949 |
$2.77 |
$27.08 |
| 1950 |
$2.77 |
$26.80 |
| 1951 |
$2.77 |
$24.84 |
| 1952 |
$2.77 |
$24.29 |
| 1953 |
$2.92 |
$25.35 |
| 1954 |
$2.99 |
$25.92 |
| 1955 |
$2.93 |
$25.43 |
| 1956 |
$2.94 |
$25.20 |
| 1957 |
$3.14 |
$26.00 |
| 1958 |
$3.00 |
$24.20 |
| 1959 |
$3.00 |
$23.96 |
| 1960 |
$2.91 |
$22.93 |
| 1961 |
$2.85 |
$22.19 |
| 1962 |
$2.85 |
$21.93 |
| 1963 |
$2.91 |
$22.14 |
| 1964 |
$3.00 |
$22.51 |
| 1965 |
$3.01 |
$22.22 |
| 1966 |
$3.10 |
$22.23 |
| 1967 |
$3.12 |
$21.78 |
| 1968 |
$3.18 |
$21.25 |
| 1969 |
$3.32 |
$21.07 |
| 1970 |
$3.39 |
$20.33 |
| 1971 |
$3.60 |
$20.70 |
| 1972 |
$3.60 |
$20.04 |
| 1973 |
$4.75 |
$24.70 |
| 1974 |
$9.35 |
$44.07 |
| 1975 |
$12.21 |
$52.78 |
| 1976 |
$13.10 |
$53.60 |
| 1977 |
$14.40 |
$55.28 |
| 1978 |
$14.95 |
$53.38 |
| 1979 |
$25.10 |
$79.75 |
| 1980 |
$37.42 |
$105.84 |
| 1981 |
$35.75 |
$91.65 |
| 1982 |
$31.83 |
$76.83 |
| 1983 |
$29.08 |
$67.98 |
| 1984 |
$28.75 |
$64.44 |
| 1985 |
$26.92 |
$58.25 |
| 1986 |
$14.44 |
$30.65 |
| 1987 |
$17.75 |
$36.36 |
| 1988 |
$14.87 |
$29.31 |
| 1989 |
$18.33 |
$34.41 |
| 1990 |
$23.19 |
$41.19 |
| 1991 |
$20.20 |
$34.53 |
| 1992 |
$19.25 |
$31.93 |
| 1993 |
$16.75 |
$27.00 |
| 1994 |
$15.66 |
$24.59 |
| 1995 |
$16.75 |
$25.59 |
| 1996 |
$20.46 |
$30.35 |
| 1997 |
$18.64 |
$27.04 |
| 1998 |
$11.91 |
$17.01 |
| 1999 |
$16.56 |
$23.08 |
| 2000 |
$27.39 |
$37.01 |
| 2001 |
$23.00 |
$30.25 |
| 2002 |
$22.81 |
$29.49 |
| 2003 |
$27.69 |
$35.05 |
| 2004 |
$37.66 |
$46.37 |
| 2005 |
$50.04 |
$59.59 |
| 2006 |
$58.30 |
$67.30 |
| 2007 |
$64.20 |
$71.94 |
| 2008 |
$91.48 |
$98.58 |
| 2009 |
$53.48 |
$57.92 |
| 2010 |
$71.21 |
$76.01 |
| 2011 |
$87.04 |
$90.08 |
| 2012 |
$86.46 |
$87.68 |
| 2013 (Partial) |
$87.13 |
$87.52 |
Monthly Average
Domestic Crude Oil Prices |
| 2011-2013 |
| Jan-11 |
$84.47 |
$89.28 |
| Feb-11 |
$81.32 |
$85.53 |
| Mar-11 |
$94.72 |
$98.66 |
| Apr-11 |
$102.15 |
$105.72 |
| May-11 |
$92.92 |
$95.72 |
| Jun-11 |
$87.92 |
$90.67 |
| Jul-11 |
$88.82 |
$91.51 |
| Aug-11 |
$77.72 |
$79.86 |
| Sep-11 |
$77.31 |
$79.31 |
| Oct-11 |
$78.00 |
$80.19 |
| Nov-11 |
$88.78 |
$91.34 |
| Dec-11 |
$90.30 |
$93.14 |
| Jan-12 |
$91.71 |
$94.18 |
| Feb-12 |
$94.06 |
$96.17 |
| Mar-12 |
$98.04 |
$99.49 |
| Apr-12 |
$95.11 |
$96.22 |
| May-12 |
$86.20 |
$87.31 |
| Jun-12 |
$74.33 |
$75.40 |
| Jul-12 |
$79.65 |
$80.93 |
| Aug-12 |
$87.13 |
$88.04 |
| Sep-12 |
$87.89 |
$88.41 |
| Oct-12 |
$82.54 |
$83.06 |
| Nov-12 |
$79.67 |
$80.55 |
| Dec-12 |
$81.23 |
$82.35 |
| Jan-13 |
$87.65 |
$88.60 |
| Feb-13 |
$86.25 |
$86.48 |
| Mar-13 |
$87.50 |
$87.50 |

See Historical Inflation Adjusted Oil Prices in Chart Form
Inflation Indexed Bonds (i-Bonds) are supposed to protect you from inflation while providing a reasonable return. How well have they done?
